Climate Change
Many people wonder, “How is climate change going to affect my family and me? How will it affect the places that I live, work, and play?” Developing location-specific predictions of changes in the climate is difficult because of the complex nature of the climate and its interactions with geography. Climate projects are especially difficult in topographically-complex areas such as the Sierra Nevada. In addition, global climate models are run at a very coarse resolution – that is, they produce information on a very large scale. Global climate models are just that – global, and each cell in the model is very large – approximately 10,000-20,000 square miles. Some people have worked to downscale climate models by using statistics and formulas to improve the resolution, or cell size – more on the order of 150-200 square miles. Yet other people are developing region-specific climate models. Because there are so many models out there, in order to get a likely more accurate picture of what might happen with climate change, we can look at many models at once.
For eastern California, we expect average temperatures to continue to increase over the next 80-90 years (through 2100). Many models show that minimum nightly temperatures may increase more quickly than maximum daytime temperatures. The future of precipitation both globally and in California is more uncertain. Some models show increases; others show decreases. In general for California, it is thought that the amount of precipitation may change very little, but the timing and seasonality may shift.
Climatic Changes in the Inyo-Mono Planning Region
Climate change impacts to hydrology in the Inyo-Mono region
Climate Change Vulnerabilities for Water Management in the Inyo-Mono Region
Climate Change Adaptation Strategies for Water Management in the Inyo-Mono Region
We did an analysis in which we broke up the Inyo-Mono region into coarse climatic sub-regions to look at potential changes in temperature and precipitation using six downscaled climate models and two greenhouse gas emissions scenario (using the World Climate Research Programme’s (WRCP’s) Coupled Model Intercomparison Project Phase 3 (CMIP3) model output archive. The results for both temperature and precipitation are available as graphs for each climatic sub-region (Walker River [includes East and West forks], Mono Basin, Upper Owens, Lower Owens, Amargosa, and Indian Wells Valley). These graphical outputs can be found in Chapter 3: Climate Change of the Inyo-Mono IRWM plan.
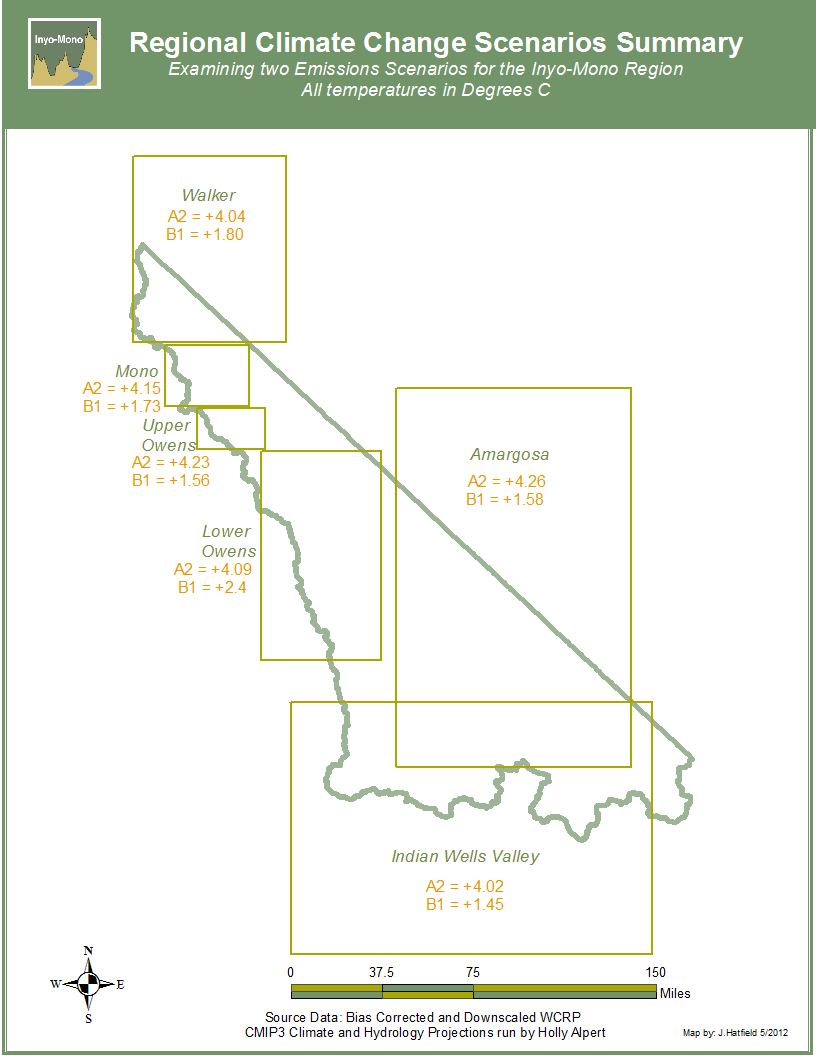
For each year included in the graphs, average temperature was calculated for the output of the six models and each of the two emissions scenarios. In addition, the highest temperature value was identified, and the lowest temperature value was identified in an attempt to elucidate the range of possible temperature scenarios. Similarly, cumulative precipitation was calculated for each year based on the model output and two emissions scenarios. An average was calculated over the six models and then a highest precipitation value was identified and a lowest value was identified in order to acknowledge the uncertainty in the projects and the range of possibilities.
What is perhaps of greater concern for most people in the eastern Sierra, however, is the changes to hydrology that increased temperatures will bring. The hydrology of our region is largely dominated by snowfall, snowmelt, and snowpack. With a changing climate, we expect less snowfall and more rain; smaller snowpack in the mountains; earlier snowmelt; and earlier runoff and peak stream flow. These changes will affect snow and water availability for municipal water supplies, irrigation and agriculture, recreation, and livelihoods, which in turn will impact local and regional economies.
Climate and Weather Data
In a recent survey sent to all water purveyors in the Inyo-Mono region, we asked what kinds of weather-related information would be helpful in managing local water systems. Most respondents answered temperature, amount of precipitation, and timing of precipitation. Fewer responses indicated snowpack, streamflow timing, streamflow amount and wind.
Respondents were also asked where they go to find weather-related data. Answers varied, but most respondents use the National Oceanic and Atmospheric Administration’s National Weather Service website. One water system indicated that it has its own meteorological station onsite; another water system responded that its water operator makes his own weather observations.
* The Desert Research Institute and Western Regional Climate Center have recently unveiled a new website that provides a large suite of tools for understanding current climatic conditions in the Great Basin, including eastern California. If you have questions about this site or need help finding information specific to your area, contact Holly.
Weather Related Resources:
- Forecasts: http://www.weather.gov/ ; http://patrol.mammothmountain.com/ (see Weather Links at bottom of page; good resource for past weather too)
- Past weather data and climate observations and data: http://www.wrcc.dri.edu/
- Presentation of DWR Resouces pertaining to Climate Change, given Oct. 22, 2014 by L. Jurkevics